Click to view the File Level Estimating Dashboard glossary.
File Level Estimating Dashboard
The File Level Estimating Dashboard allows users to view and measure the Repair Estimating trends over time and view details at a claim level. The dashboard provides a series of visualizations to summarize trends related to the Estimating process.
This dashboard allows carriers to:
-
Measure Total Repair Cost, and Breakout Part, Labor, Paint, Tax and Miscellaneous Cost.
-
Measure time taken to Respond/ Appraise Assignments, and Correct/ Update Estimates via Supplement(s).
-
Breakout these measurements by multiple dimensions of Location, Vehicle, Claim, and Policy.
-
Breakout the Individual, Team, Claim Office and Company completing the appraisals.
-
Breakout these by the Original E01 vs the Following Supplements.
Dashboard Basics
Follow the steps below to access the Dashboard via the CCC® Portal.
| Step | Action |
|---|---|
| 1 | Enter your User ID and Password to login to the CCC® Portal. |
| 2 |
Click the Tableau Reporting & Analytics link in the Analytics section of the CCC® Portal home page. A new Analytics window opens. |
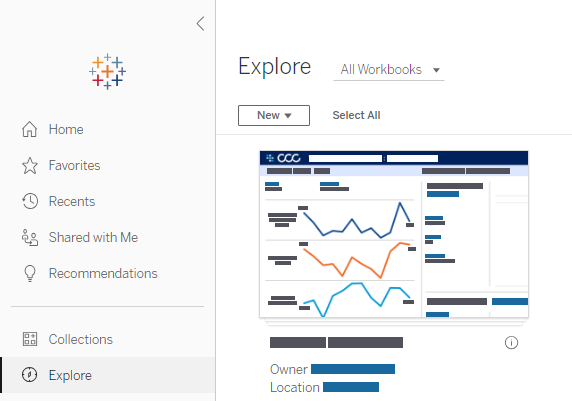
| 3 | Click Explore on the left-side panel. |
| 4 | Select All Workbooks from the drop-down. |
| 5 |
Select the desired Dashboard. |
| Stage | Description |
|---|---|
| 1 |
Hover over dashboard elements to view additional details. |
| 2 |
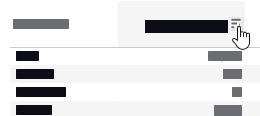
Click Sort to sort the column in Ascending or Descending order or View Data. |

-
Select tabs to switch between dashboard views.
-
Displays the Date Range based on the selection from the Date filter.
-
The Data Last Refreshed indicates the last date and time the data was refreshed in the dashboard.
-
The Latest File Sent Date indicates the latest date in the date range based on the selected date anchor.
-
The Hide/Show Trends toggle hides/shows the left-side trends panel.
-
Select the Book icon to view the glossary.
-
Select the Question Mark icon to enable a help overlay for dashboard tips.
Dashboard Filters
| Stage | Description |
|---|---|
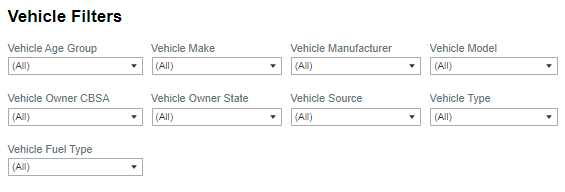
| 1 | Select the Vehicle Age Group, Vehicle Make, Vehicle Manufacturer, and Vehicle Model to include. |
| 2 | Select the Vehicle Owner CBSA (Core Based Statistical Area) and Vehicle Owner State to include. |
| 3 | Select the Vehicle Source to include such a European, Domestic, and/or Unknown. |
| 4 | Select the Vehicle Type to include such as Commercial Vehicles, Standard, and/or Unknown. |
| 5 | Select the Vehicle Fuel Type to include such as Diesel, Electric, Hybrid, Natural Gas, and/or Unknown. |
| Stage | Description |
|---|---|
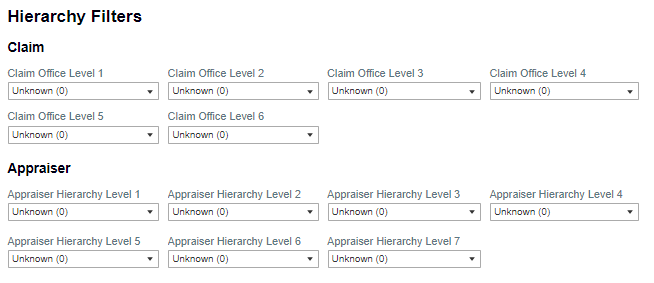
| 1 | Displays the Claim Office by Level Hierarchy filter options. |
| 2 | Displays the Appraiser by Level Hierarchy filter options. |
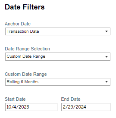
| Stage | Description |
|---|---|
| 1 | Anchor Date: Select a claim lifecycle date when you want the dashboard graphs to begin displaying data. |
| 2 | Date Range Selection: Select either a Custom Date Range or a Fixed Date Range. |
| 3 | Custom Date Range: Select a Rolling, Current, Prior, etc. date range option, when the Date Range Selection dropdown option Custom Date Range is selected. |
| 4 | Start/End Date Picker: Enter or select a Fixed date from the fields, when the Date Range Selection dropdown option Fixed Date Range is selected. |
| Stage | Description |
|---|---|
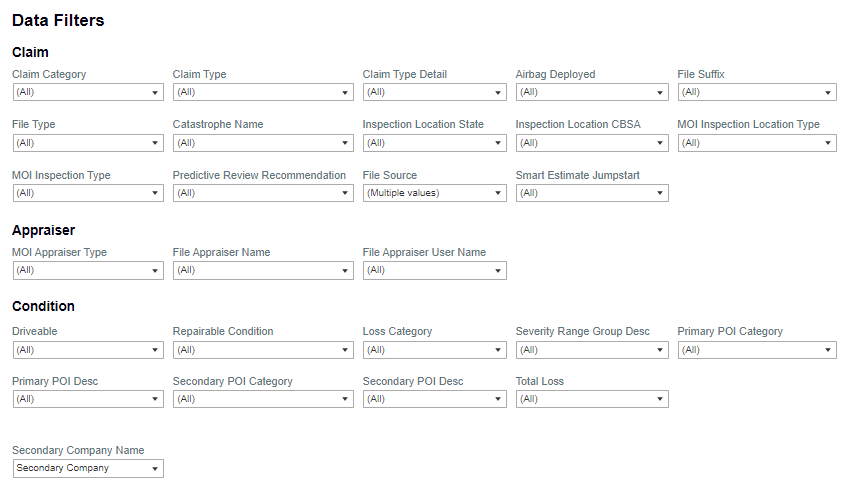
| 1 | The Claim Detail filter options allow you to select the types of data related to the claim to display in the dashboard. The dataset is at the transaction level and you can have multiple transactions or records for each claim. |
| 2 | The Appraiser filter options allows you to change the MOI and File appraisers displayed in the dashboard. |
| 3 | The Condition filter options allows you to select the types of vehicle conditions to include in the dashboard such as Drivable or Primary Point of Impact (POI). |
Dashboard Tabs
| Stage | Description |
|---|---|
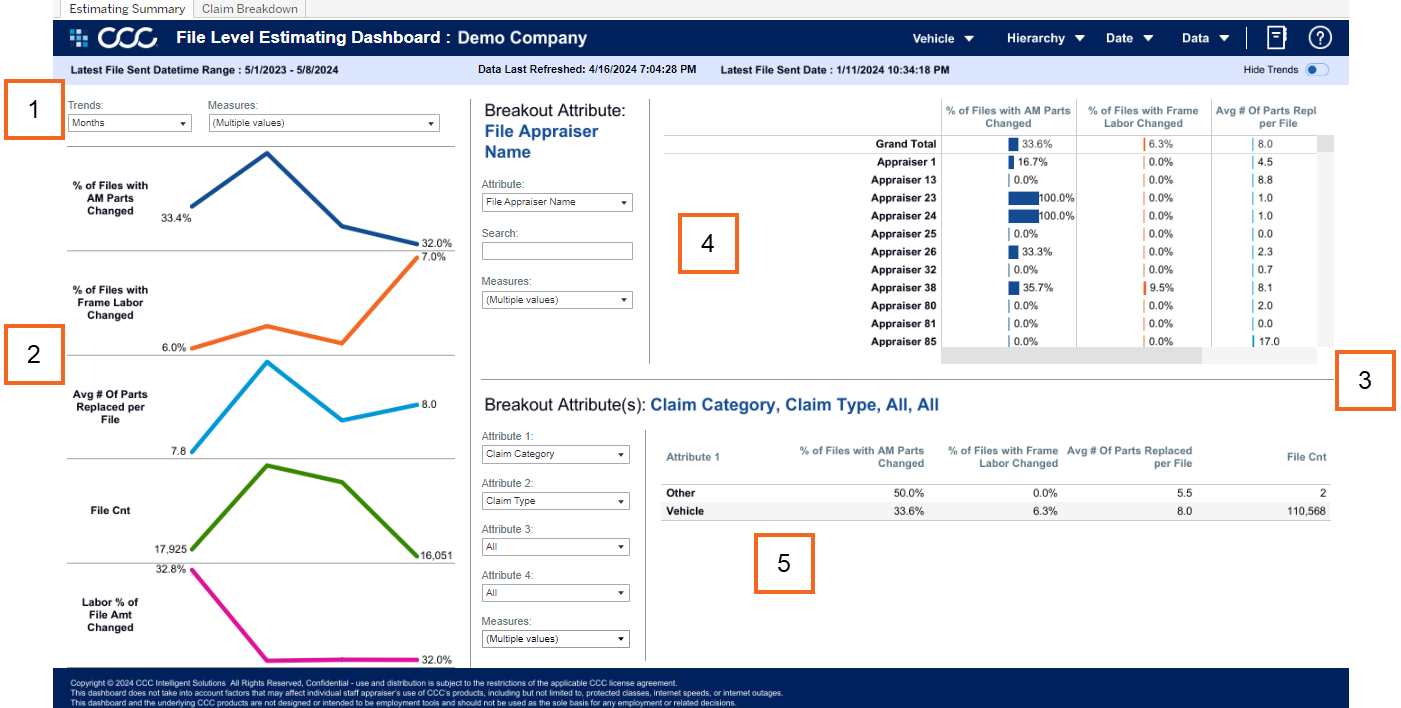
| 1 |
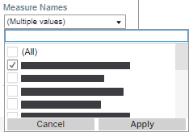
Select the following drop-downs to populate the line chart:
|
| 2 |
Shows the line charts based on the Trend and Measures selected. Note: Hide Trends as needed by selecting the Toggle in the upper-right corner. |
| 3 |
The Breakout Attributes sections display the selected Attribute and Measures selected.
|
| 4 |
The top Breakout Attribute section shows an analyzes of a single Attribute in a bar graph by the Measure(s) selected. Note: The Search drop-down allows for including or excluding Attributes. |
| 5 | The bottom Breakout Attribute(s) section shows an aggregate view of up to four (4) of the selected Attributes, based on the Measure(s) selected. |
| Stage | Description |
|---|---|
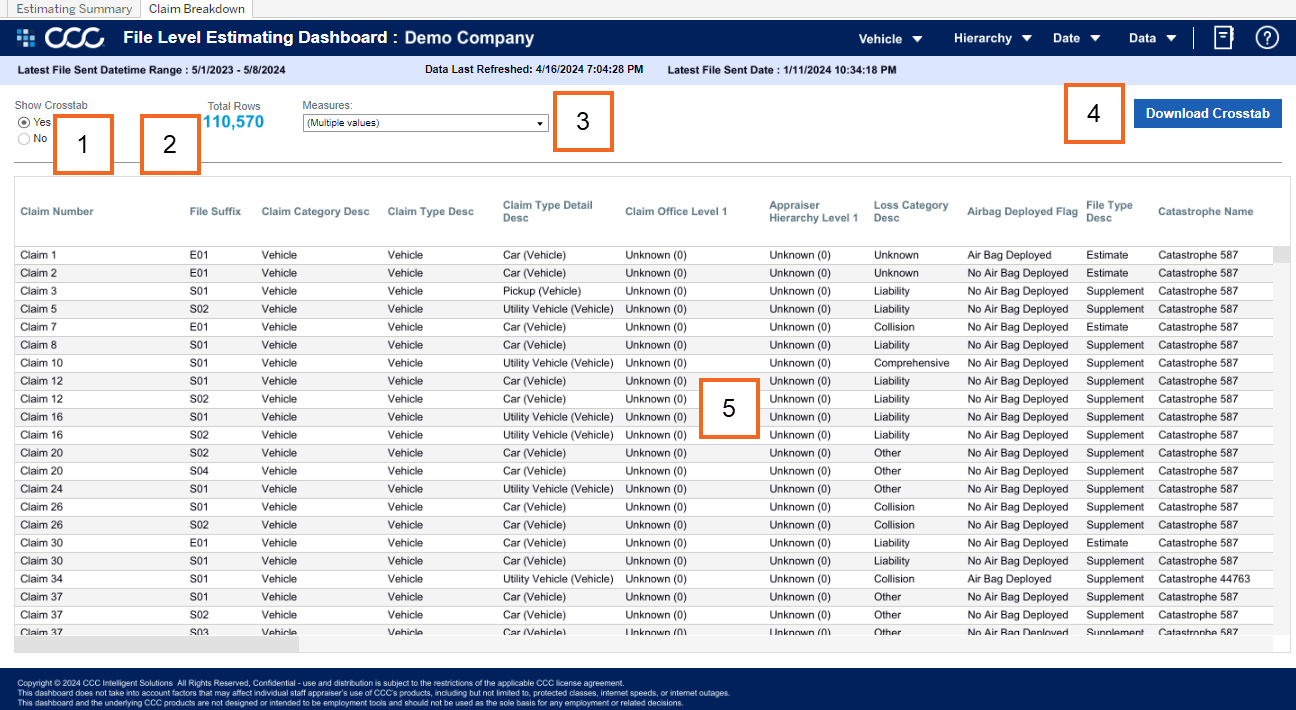
| 1 | Select Yes from the Show Crosstab section to display the data in the grid. |
| 2 | The Total Rows area displays the count of records in the grid. |
| 3 | Use the Measures dropdown to select specific measures to display in the data in the grid. |
| 4 | Click Download Crosstab to download the grid data in an Excel or CSV format. |
| 5 | The Data Detail section shows all the attributes/data points that reference the options selected. |

