Note: See Toolbars and Icons for a legend of icons in Analytics.
To export a grid report to another application:
- With the Report Home tab selected, click the Export icon at the top of the page. The Export Options page appears.
- Select whether you want to export the Whole report or only the Portion displayed only from the Export droplist.
- Select an export format. You have the following options:
- Excel with plain text exports the report into Microsoft Excel as plain text. The content of the report is displayed using the default settings of Microsoft Excel. The overall structure and format of the report as displayed in CCC ONE® Analytics is not retained.
- CSV file format exports the report into a comma separated values format (suitable for Microsoft Access and Lotus 1-2-3) as plain text. The overall structure and format of the report as displayed in CCC ONE® Analytics is not retained.
- Excel with formatting exports the report into Microsoft Excel with the same formatting, color, and overall structure that appears in CCC ONE® Analytics.
Note: Excel 2000 or higher is required for exporting grids with formatting. The formatting is controlled using Cascading Style Sheets (CSS), which are not supported in previous versions of Microsoft Excel. If you export to Excel 2000, you must download the Office 2000 Service Release 1 or Service Release 1a (SR-1a) from Microsoft. Microsoft Excel does not support all the colors that most Web browsers do, so some styles may have different colors in Excel than the colors they have in Analytics. Exporting formatted data is more system resource intensive than exporting plain text data. We recommend using the one of the plain text options for large result sizes.
- HTML exports the report to an HTML page. The overall structure and format of the report (including font and color) as displayed in Insurance Reporting appears on your browser.
- Plain text exports the report to a plain text page. The overall structure and format of the report as displayed in CCC ONE® Analytics is not retained. Only the content of the report, displayed as text, appears in your browser. You can choose a comma, tab, semicolon, or space to separate the fields of text in the Delimiter droplist.
- If exporting to Excel with formatting you may reformat certain items as text:
- To reformat metric values from numeric to text format, select the Export metric values as text check box.
- To reformat headers into text format, select the Export headers as text check box.
- To show filter information in an exported report, select the Export filter details check box. To export the report without filter details, clear the check box.
- When exporting graphs, you can specify if the graph is exported as a live Excel graph by selecting the Export graphs as live Excel charts check box. When this setting is enabled, you can manipulate an exported graph using Excel. For example, you can export a graph to Excel, and then change the graph's type using the menus and options in Excel.
- Expand all page-by fields allows you to print all combinations of items in the Page-by axis when printing a report that has one or more items in the Page-by axis. To print only the items currently displayed, clear this check box.
- If exporting to Excel with formatting, you can remove the "Metrics" column from a report by selecting Yes, No, or Automatic from the Remove extra column dropdown box. . To export the report, click Export. The report is exported in the selected format.
- To export the report, click Export. The report is exported in the selected format.
Note: Leave the Do not prompt me again check box unchecked. If you check it, you will not be able to adjust the format of the reports that you export in the future. To remove the checkmark call CCC Technical Support.
To export a graph report to another application:
- Click the Export icon located in the report toolbar. The Export Options page opens.
- In the Export droplist, select whether you want to export the Whole report or Portion displayed Only.
- Select an export format. You have the following options:
- Excel with formatting exports the graph report into Microsoft Excel with the same formatting, color, and overall structure that appears in Insurance Reporting. If you are exporting a graph with a grid to Excel 2000, then you can choose to export the grid either with or without formatting. See the Exporting Grids section (above) for the differences between the grid options. The way you choose to export the grid does not affect the graph.
- HTML exports the report to an HTML page. The overall structure and format of the report (including both the graph and grid, if applicable) is preserved in the exported version.
Note: If you export to Excel 2000, you must download the Office 2000 Service Release 1 or Service Release 1a (SR-1a) from Microsoft. Microsoft Excel does not support all the colors that most Web browsers do, so some styles may have different colors in Excel than the colors they have in CCC ONE® Analytics . A problem occurs if you choose to export to Excel 2000 but your computer does not have Excel 2000. Since CCC® Analytics cannot detect what version of Excel your machine has, it tries to export to Excel, if Excel 2000 is chosen. A grid can be exported, but a graph cannot. This is a known issue, and you should not choose to export to Excel 2000 if you do not have Excel 2000.
You would typically use Direct Export if you already know what the report looks like and want to view it directly in one of the exported formats. If desired, you can export the "first report page only" to preview the data before you export the whole report.
To export a report that you do not want to first view in the Result page:
- Navigate to the folder where the object is located, or to the History List if it is located there.
- If the folder browser is in Large Icon View, click the Export link. Or, if the folder browser is in List View or the History List, click the Export icon in the Actions column.
This allows you to answer any potential prompts, select export options, and view the report in the final exported format.
Leave the check box Do not prompt me again unchecked, if you check it, you will not be able to adjust the format of the reports that you export in the future. In order to remove the checkmark, call CCC Technical Support.
To make a PDF from a grid or graph report:
- Click the PDF icon located on the Standard toolbar. The PDF Options page opens.
- Specify settings for the PDF report, such as the scaling and orientation of the exported report.
- Click the Show Advanced Options button to reveal additional settings such as paper size, margins, and header and footer sizes. Select the Embedded fonts check box to determine if you want to use the original fonts chosen in the Document Editor to display and print the PDF, even on machines that do not have those fonts installed. This ensures the portability of the PDF.
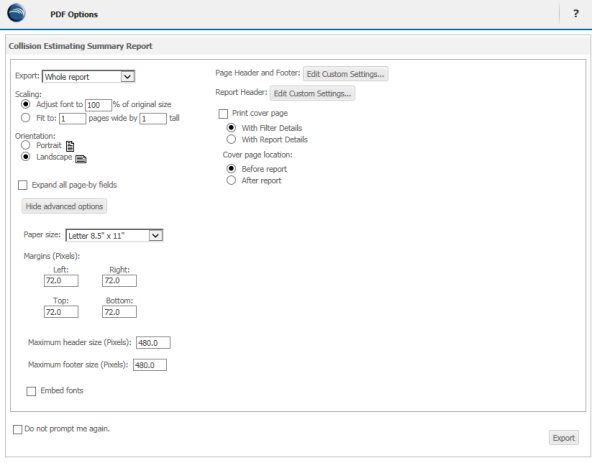
- You can specify the text to be displayed at the top (header) and at the bottom (footer) of each printed page. Click the Edit Custom Settings button to access the Header/Footer Editor page. You can specify what text to print in the left, center, and right portions of the header and footer - you can simply type this text or insert fields specific to the report by clicking "insert" icons near the top of the page. These options include: page number, number of pages, date, time, project name, report name, template name, filter name, filter details, and user name.
- To create the PDF, click Export. The report is exported to a PDF file and displayed in Adobe Reader:
- Click the PDF icon located on the Standard toolbar. The PDF Options page opens.
- Specify settings for the PDF report, such as the scaling and orientation of the exported report.
- Click the Show Advanced Options buttons to reveal additional settings such as paper size, margins, and header and footer sizes. Select the Embedded fonts check box to determine if you want to use the original fonts chosen in the Document Editor to display and print the PDF, even on machines that do not have those fonts installed. This ensures the portability of the PDF.
- You can specify the text to be displayed at the top (header) and at the bottom (footer) of each printed page. Click the Edit Custom Settings button to access the Header/Footer Editor page. You can specify what text to print in the left, center, and right portions of the header and footer - you can simply type this text or insert fields specific to the report by clicking "insert" icons near the top of the page. These options include: page number, number of pages, date, time, project name, report name, template name, filter name, filter details, and user name.
- Click Export. The report is exported to a PDF file and displayed in Adobe Reader.
Note: PDF (Portable Document Format) is a standard created by Adobe Systems, Incorporated. To view the PDF file, you must have Adobe Reader version 4 or greater installed on your computer. Download Adobe® Reader.
You would typically use Direct Export to PDF if you already know what the report looks like and want to view it directly in PDF format. If desired, you can export the first report page only to preview the data before you export the whole report.
To export to PDF a report that you do not want to first view in the Result page:
- Navigate to the folder where the object is located or to the History List if it is located there.
- If the folder browser is in Large Icon View, click the PDF link. Or, if the folder browser is in List View or History List, click the PDF icon in the Actions column.
This allows you to answer any potential prompts, select export options, and view the report in the final PDF format.
- Go to the folder where the object is located, or to the History List (if it is located there).
- If the folder browser is in Large Icon View, click the PDF link. Or, if the folder browser is in List View or History List, click the PDF icon in the Actions column.
This allows you to answer any potential prompts, select export options, and view the report in the final PDF format.
