The new Shortcuts Toolbar appears at the top of your screen. You can use the icons to quickly go to previously viewed screens or folders. The breadcrumb shows the current section (Claim Insight) that is being viewed (see the image below). Additionally, you can click the breadcrumb to go back to a specific section. For example, if you click Standard Reports, the Standard reports section appears. You can also search for reports, folders, etc. using the search icon or access the help section. To access additional option click the downward arrow next to the home icon, many of these options can also be found in the left side panel within a report folder shown below.

|
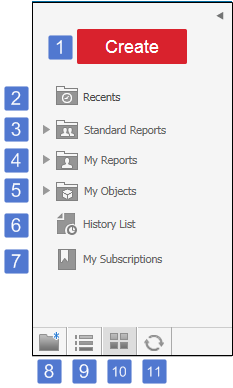
Left Side Panel:
|
|
Design Mode Toolbar:
(Visible when editing a report made in design mode)
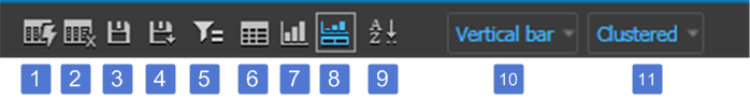
| 1. Run Report | 2. Cancel | 3. Save | 4. Save as |
| 5. Filter | 6. Grid | 7. Graph | 8. Grid and Graph |
| 9. Sort... | 10. Select Graph Type | 11. Select Graph Layout |
While working on reports, you can click the home icon to access a droplist menu with options (such as Projects, or My Subscriptions).
Report Home Tab:
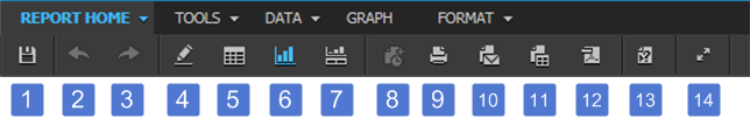
| 1. Save | 2. Undo | 3. Redo | 4. Design |
| 5. Grid | 6. Graph | 7. Grid and Graph | 8. Add to History |
| 9. Print | 10. Send Now | 11. Export | 12. PDF |
| 13. Re-prompt | 14. Full Screen Mode |
Tools Tab:
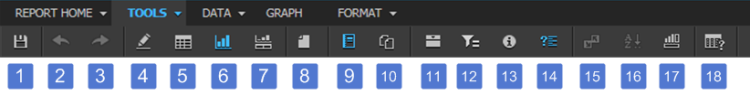
| 1. Save | 2. Undo | 3. Redo | 4. Design |
| 5. Grid | 6. Graph | 7. Grid and Graph | 8. New... |
| 9. Report Objects | 10. Related Reports | 11. Page-by Axis | 12. View Filter |
| 13. Report Details | 14. Prompt Details | 15. Show pivot buttons | 16. Show sort buttons |
| 17. Graph Zones | 18. Report Options... |
Data Tab:

| 1. Save | 2. Undo | 3. Redo | 4. Design |
| 5. Grid | 6. Graph | 7. Graph and Grid | 8. Add View Filter Condition... |
| 9. Sort... | 10. Drill... | 11. Filter on Sections... | 12. Hide nulls/ zeros |
| 13. Refresh | 14. Re-prompt | 15. Swap Rows and Columns | 16. Insert New Metric... |
| 17. Rename/ Edit Objects... | 18. Show Totals | 19. Edit Totals... | 20. Quick Thresholds (select a metric) |
| 21. Toggle Thresholds | 22. Visual Thresholds Editor |
|
Grid Tab:
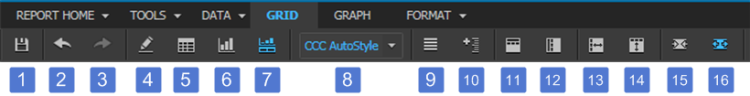
| 1. Save | 2. Undo | 3. Redo | 4. Design |
| 5. Grid | 6. Graph | 7. Grid and Graph | 8. Select Grid Type |
| 9.Banding | 10. Outline | 11. Merge Column Headers | 12. Merge Row Headers |
| 13. Lock Row Headers | 14. Lock Column Headers | 15. Auto Fit to Contents | 16. Auto Fit to Window |
Graph Tab:

| 1. Save | 2. Undo | 3. Redo | 4. Design |
| 5. Grid | 6. Graph | 7. Graph and Grid | 8. Select Graph Type |
| 9. Select Graph Layout | 10. Legend | 11. Data Values | 12. Series by Row |
| 13. Series by Column | 14. Auto Arrange | 15. Categories | 16. Series |
| 17. Apply |
Format Tab:
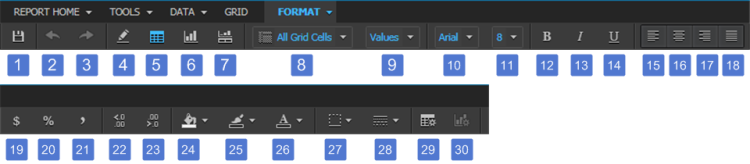
| 1. Save | 2. Undo | 3. Redo | 4. Design |
| 5. Grid | 6. Graph | 7. Grid and Graph | 8. Grid/ Graph Format |
| 9. Select Format (based on Grid/ Graph selected) |
10. Select Font | 11. Select Font Size | 12. Bold Font |
| 13. Italic Font | 14. Underline Font | 15. Left Justify | 16. Center |
| 17. Right Justify | 18. Center | 19. Currency Style | 20. Percent Style |
| 21. Comma Style | 22. Increased Decimal | 23. Decrease Decimal | 24. Fill Color |
| 25. Line Color | 26. Text Color | 27. Bottom | 28. Border and Line Style |
| 29. Advance Grid Formatting | 30. Advance Graph Formatting |
