Click to view the Estimate Review Line Detail Dashboard glossary.
Estimate Review Line Detail Dashboard
The Estimate Review Line Detail Dashboard assists in providing an understanding line-level behaviors by Appraisers and Reviewers regarding the accuracy of writing an estimate. This dashboard allows managers and individuals to see cost savings of reinspection teams and the accuracy of their appraisers. Additional it identifies the overall utilization around the Estimate Review product and the supplement request response rate of the appraiser.
This dashboard allows carriers to:
-
Reviewer managers to compare how their team is performing against the average.
-
Reviewer managers can compare how individual reviewers are performing against their peers.
-
View how many reviews were completed and the associated cost savings, broken out by appraiser, appraiser state, appraiser type, etc.
-
Analyze trends over time by specific metrics or breakout attributes.
-
Identify claims that require action as identified through the dashboard.
Dashboard Basics
Follow the steps below to access the Dashboard via the CCC® Portal.
| Step | Action |
|---|---|
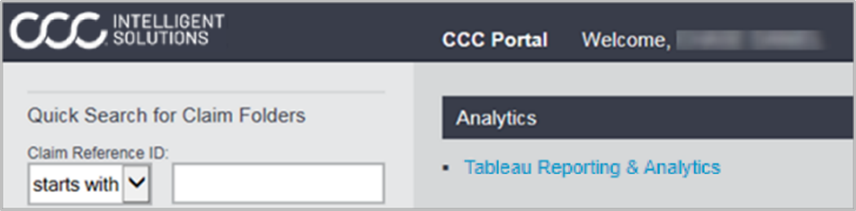
| 1 | Enter your User ID and Password to login to the CCC® Portal. |
| 2 |
Click the Tableau Reporting & Analytics link in the Analytics section of the CCC® Portal home page. A new Analytics window opens.
|
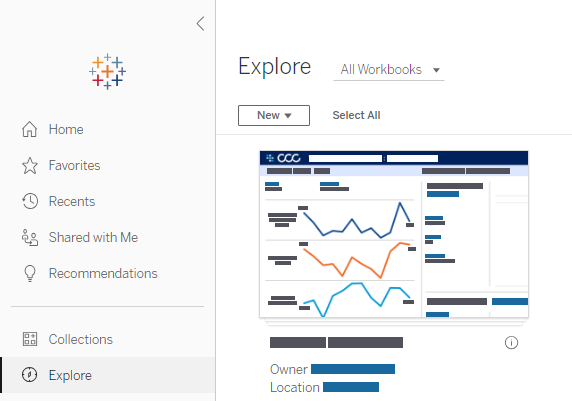
| 3 | Click Explore on the left-side panel. |
| 4 | Select All Workbooks from the drop-down. |
| 5 |
Select the desired Dashboard.
|
| Stage | Description |
|---|---|
| 1 |
Hover over dashboard elements to view additional details.
|
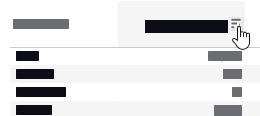
| 2 |
Click Sort to sort the column in Ascending or Descending order or View Data.
|


-
Select tabs to switch between dashboard views.
-
Displays the Date Range based on the selection from the Date filter.
-
The Data Last Refreshed indicates the last date and time the data was refreshed in the dashboard.
-
The Hide/Show Trends toggle hides/shows the left-side trends panel.
-
Select the Book icon to view the glossary.
-
Select the Question Mark icon to enable a help overlay for dashboard tips.
Dashboard Filters
| Stage | Description |
|---|---|
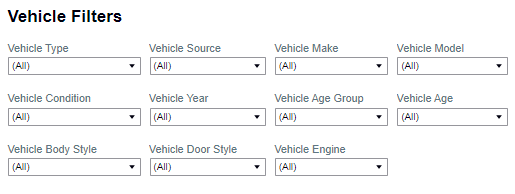
| 1 | Select the Vehicle Type to include such as Commercial Vehicles, Standard, and/or Unknown. |
| 2 | Select the Vehicle Source to include such a European, Domestic, and/or Unknown. |
| 3 | Select the Vehicle Make and Vehicle Model to include. |
| 4 | Select the Vehicle Condition to include such as Non-Repairable and/or Repairable. |
| 5 | Select the Vehicle Year, Vehicle Age Group, Vehicle Age to include. |
| 6 |
Select the Vehicle Body Style, Vehicle Door Style, Vehicle Engine to include. |
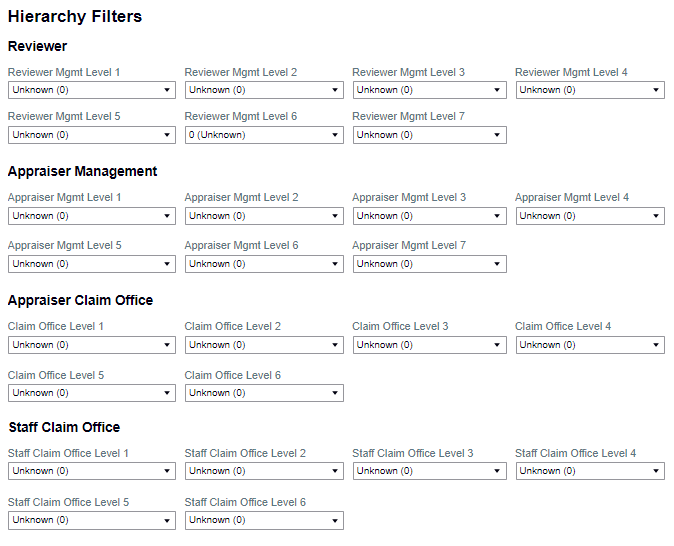
| Stage | Description |
|---|---|
| 1 | Select the Reviewer filters for each level. |
| 2 | Select the Appraiser Management filters for each level. |
| 3 | Select the Appraiser Claim Office filters for each level. |
| 4 | Select the Staff Claim Office filters for each level. |
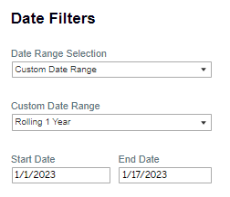
| Stage | Description |
|---|---|
| 1 | Date Range Selection: Select either a Custom Date Range or a Fixed Date Range. |
| 2 | Custom Date Range: Select a Rolling, Current, Prior, etc. date range option, when the Date Range Selection dropdown option Custom Date Range is selected. |
| 3 | Start/End Date Picker: Enter or select a Fixed date from the fields, when the Date Range Selection dropdown option Fixed Date Range is selected. |
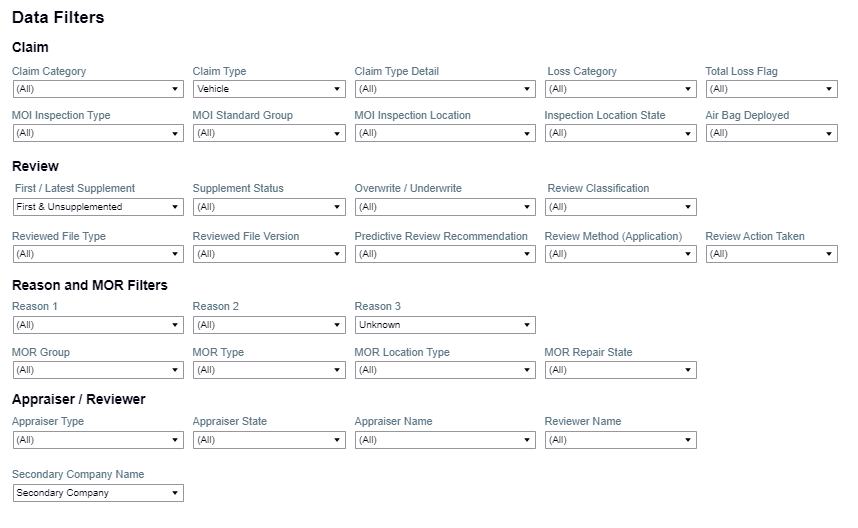
| Stage | Description |
|---|---|
| 1 |
The Claim filter options allow you to change the type of claim data displayed in the dashboard. |
| 2 |
The Review filter options allow you to change the types of reviews/ supplement completed and their status on the claim. |
| 3 | The Reason and MOR Filters filter options allow you to change the types of configured reasons and Method of Reinspections (MOR) to display in the dashboard. |
| 4 | The Appraiser/Reviewer filter options allows you to change the appraisers and reviewers displayed in the dashboard. |
Dashboard Tabs
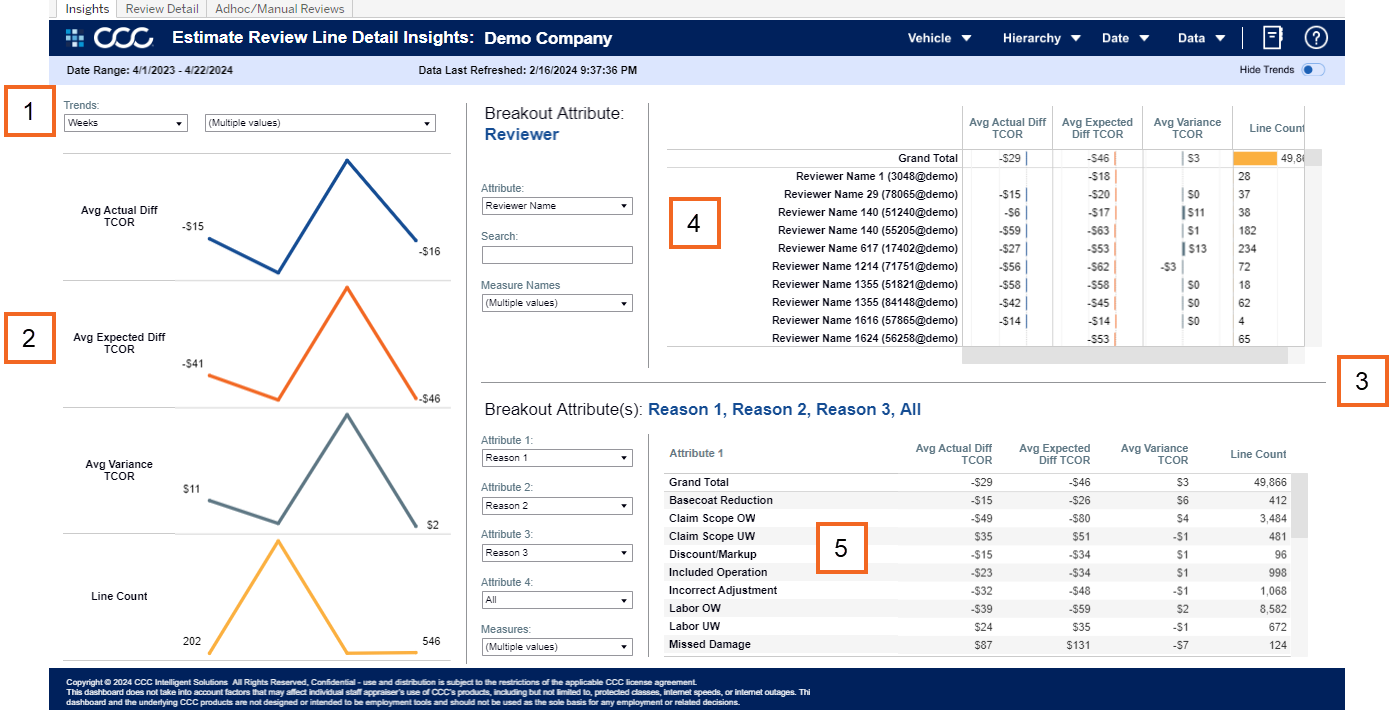
| Stage | Description |
|---|---|
| 1 |
Select the following drop-downs to populate the line chart:
|
| 2 |
Shows the line charts based on the Trend and Measures selected. Note: Hide Trends as needed by selecting the Toggle in the upper-right corner. |
| 3 |
The Breakout Attributes sections display the selected Attribute and Measures selected.
|
| 4 |
The top Breakout Attribute section shows an analyzes of a single Attribute in a bar graph by the Measure(s) selected. Note: The Search drop-down allows for including or excluding Attributes. |
| 5 | The bottom Breakout Attribute(s) section shows an aggregate view of up to four (4) of the selected Attributes, based on the Measure(s) selected. |
| Stage | Description |
|---|---|
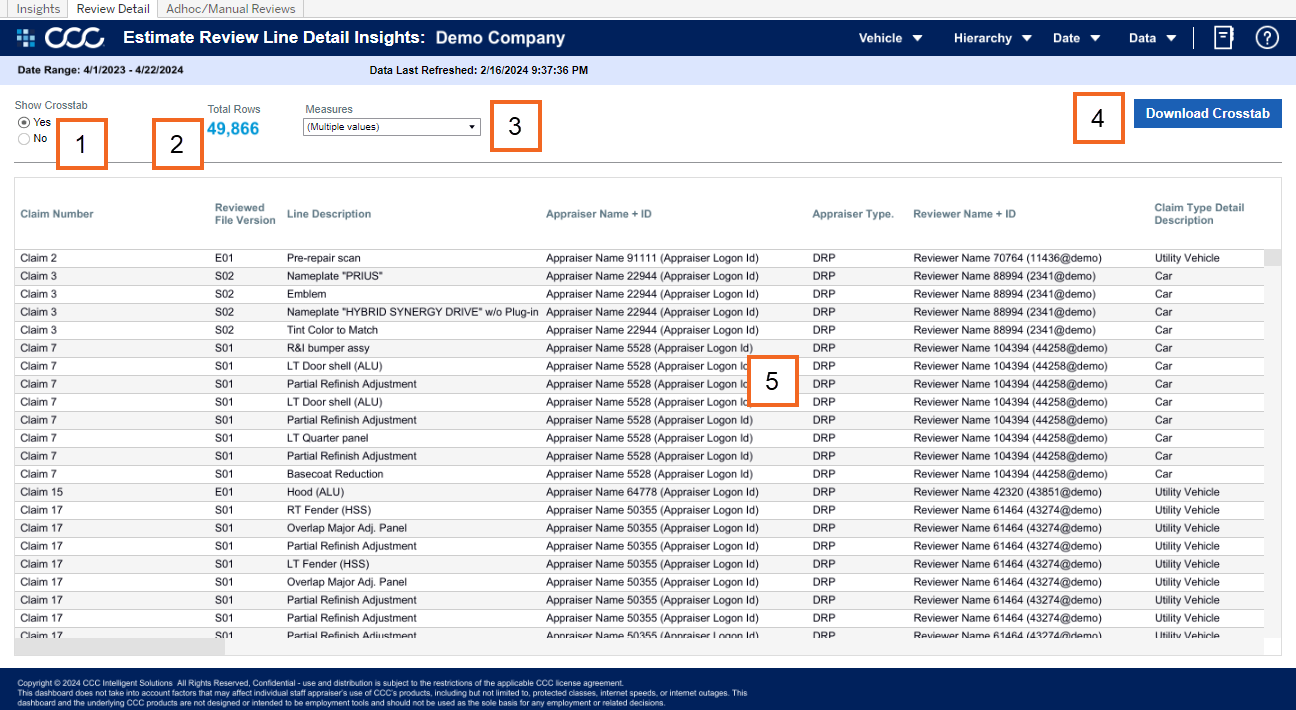
| 1 | Select Yes from the Show Crosstab section to display the data in the grid. |
| 2 | The Total Rows area displays the count of records in the grid. |
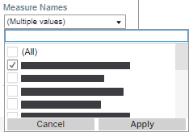
| 3 | Use the Measures dropdown to select specific measures to display in the data in the grid. |
| 4 | Click Download Crosstab to download the grid data in an Excel or CSV format. |
| 5 | The Data Detail section shows all the attributes/data points that reference the options selected. |
| Stage | Description |
|---|---|
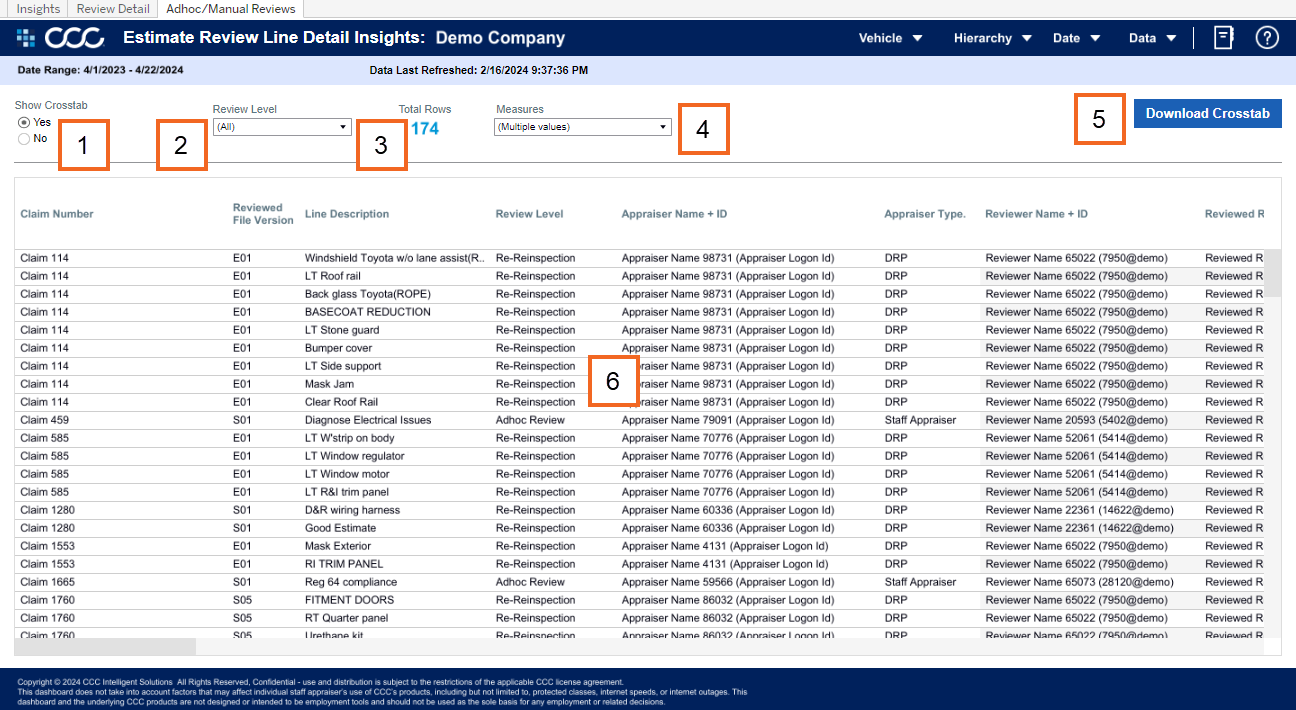
| 1 | Select Yes from the Show Crosstab section to display the data in the grid. |
| 2 | Use the Review Level dropdown to select specific types of reviews to display in the grid. |
| 3 | The Total Rows area displays the count of records in the grid. |
| 4 | Use the Measures dropdown to select specific measures to display in the data in the grid. |
| 5 | Click Download Crosstab to download the grid data in an Excel or CSV format. |
| 6 | The Data Detail section shows all the attributes/data points that reference the options selected. |
