The Claim Insight Insurance Home Office Dashboard (aka Dashboard) gives you a graphical view of the life cycle of your claims including estimate, total loss, reinspection, audit, and salvage information.
Tip: Use the Dashboard toolbar to perform common functions such as save, send, print or resize the Dashboard.

To Access the Dashboard
- Click the CCC Claim Insight project folder. The CCC Claim Insight > Standard Reports screen appears.
- Click Claim Insight Dashboard.
The four panels in the dashboard are:
- Vehicle Average Repair Cost
- Vehicle Average Final Valuation Amount
- Claim Activity Days Average
- Key Performance Indicators
The Vehicle Average Repair Cost and the Vehicle Average Final Valuation Amount line graphs compare your company's averages versus the national industry averages. Notice the 3 droplists in the images below. As you make your selections (in the droplists), the graph is redrawn automatically.
Average Repair Cost Graph and the Average Final Valuation Amount Graph
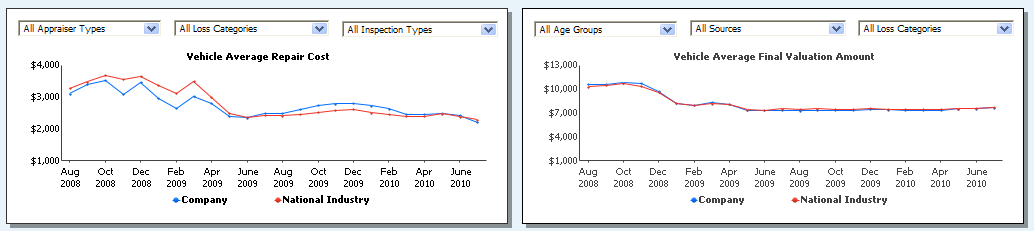
To Create an Average Repair Cost Graph
- Select an Appraiser Type.
- Select a Loss Category.
- Select an Inspection Type.
To Create an Average Final Valuation Amount
- Select an Age Group.
- Select a Source
- Select a Loss Category.
- Select an Inspection Type.
The Claim Activity Days Average Bar Graph shows 9 cycle times spanning the life of the claims. You can select up to five time periods and at least 2 attributes - one attribute from each group on the left side of the graph. As you make your selections, the graph is redrawn automatically. Notice that each time period is represented by a colored bar in the graph. So, if you select 2 time periods, then 2 bars appear in the graph for each cycle time.
Claim Activity Days Average Bar Graph
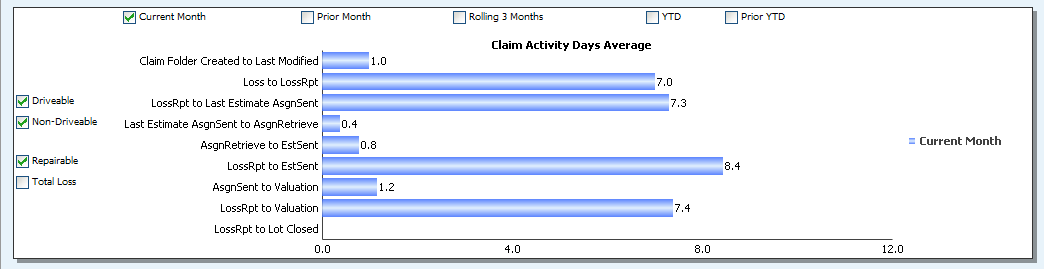
Creating a Claim Activity Days Average Graph
- Select a time period.
- Select either Driveable, Non-Driveable, or both.
- Select either Repairable, Total Loss, or both.
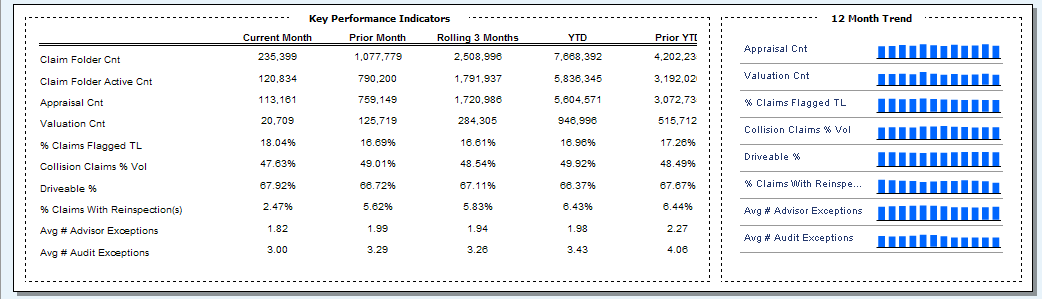
The Key Performance Indicators and the 12 Month Trend panel contains vital information about your company's performance.
Key Performance Indicators and the 12 Month Trend panel
Use the Dashboard toolbar to perform common functions such as save, send, print,or resize the Dashboard.
